
The Learning Counsel’s Digital Transition Survey 2020 posed many questions aimed at discovering the transition tactics of schools. What was found indicates that most schools consider they are further along in digital transition than they actually are, and that they are missing basic understanding of just how far technology could take them in transformation. This is critical today because quarantines continue and there is talk of keeping shutdowns going for as long as several more years.
Numerous superintendents have mentioned in Learning Counsel virtual meetings in 2020 that they do not think “normal” is coming back. In attempting to describe what might be the new normal, many mention more remote learning for a larger percentage of the students, permanent hybrid models, and personalization. None have delved into how all of that will really work without overburdening teachers.
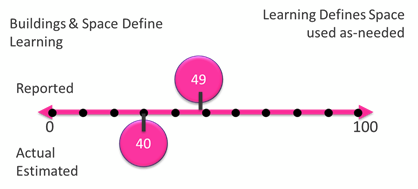
Analysts reviewing the directionality of school transition asked respondents to self-evaluate their progression on a scale of opposites.
With regards to the impact/use of space, survey respondents rated their schools and districts at 49 on the progression away from buildings and space defining learning towards 100 where learning defines the space used as needed. Based on all other data in the survey, analysts gave the nation’s average at only 40, a 9-point difference between what respondents think they have achieved in shifting how space impacts and is used in learning.
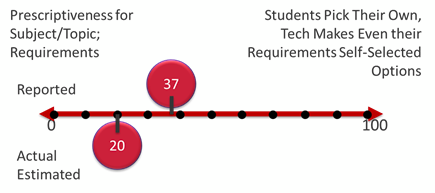
With regards to the selection of subjects and topics, survey respondents rated their schools and districts at 37 on the progression away from prescriptiveness for subjects and topics or requirements towards 100 where students pick their own and/or tech makes even their requirements self-selected options (sometimes in the way these requirements are delivered). Based on all other data in the survey, analysts gave the nation’s average at only 20, a 17-point difference between what respondents think they are doing in providing options versus what they are actually doing.
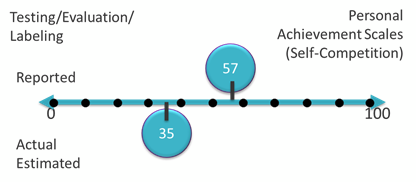
With regards to the student evaluation, survey respondents rated their schools and districts at 57 on the progression away from testing, school or teacher-based evaluation and labeling (with grades, marks, or scores) versus personal achievement scales where a student essentially is self-competing towards a next level of learning. Based on all other data in the survey, analysts gave the nation’s average at only 35, a 22-point difference between what respondents think they are doing to deliver learning measures that are personal scales of achievement versus age-old traditional testing, evaluation, and labeling with A-F or 0-100, etc.
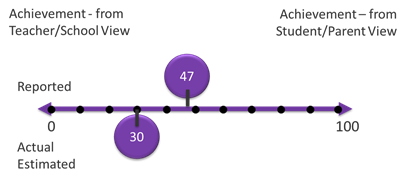
Different than the evaluation question, being customer-oriented means being driven not by internal rules but by satisfied customers. With regards to the view of achievement in use, survey respondents rated their schools and districts at 47 on the progression from a view based on the teacher or school measurements with 100 being a shifted view to achievement from the view of the student or parent. Based on all other data in the survey, analysts gave the nation’s average at only 30, a 17-point difference between what respondents think they have achieved in shifting to a customer-oriented perception versus what they have actually achieved.
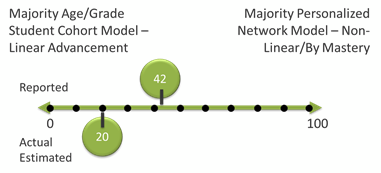
With regards to the predominant model, survey respondents rated their schools and districts at 42 on the progression from being structured with the majority of students on the age/grade cohort model with linear advancement versus 100 being the attainment of the majority of students on a personalized network-based model that was built to be non-linear and students advance by mastery. Based on all other data in the survey, analysts gave the nation’s average at only 20, a 22-point difference between what respondents think they have achieved versus what they have actually achieved.
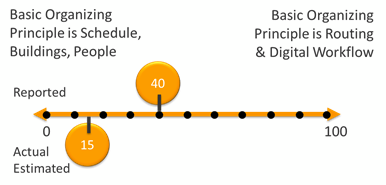
With regards to the basic organizing principles in use, survey respondents rated their schools and districts at 40 on the progression from a principle centered on a proffered schedule, buildings and people versus advanced routing and digital workflow. Based on all other data in the survey, analysts gave the nation’s average at only 15, a 25-point difference between what respondents think they have achieved versus what they have actually achieved.
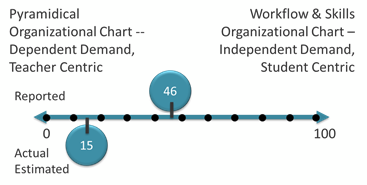
With regards to the organizational charts of schools, survey respondents rated their schools and districts at 46 on the progression from being pyramidically organized with Superintendents at the top, mid-level management and teachers and students at the bottom and a teacher-centric dependent-demand orientation. At 100 would be a reorganization of the organizational chart around workflow and skills with a student-centric, independent demand model that delivers exactly personalized paths. Based on all other data in the survey, analysts gave the nation’s average at only 15, a 31-point difference between what respondents think they have achieved versus what they have actually achieved.
Survey questions used a backdrop of the Learning Counsel’s own “Education Transformation Stages & Endpoint” scale. These stages are the natural progression of schools in terms of their activities until they arrive at a redesign of their teaching and learning models and the highest point, becoming “expo centers of learning.” Expo is short for “experiential,” a point of highly crafted digital workflow logistics that personalize learning journeys for every student while also making sure to keep highly valued live-teacher intersections with some small or whole group learning. This shift away from the century-old manufacturing-oriented whole group class and grade paradigm depends on new extremes of schedule architecting and lesson building such that the live intersection points are triggered by the student’s achievement pace. Auto-cohorting with digital identity infused into the educational routing of each student is a new and expansive re-architecting of the way institutions would run.
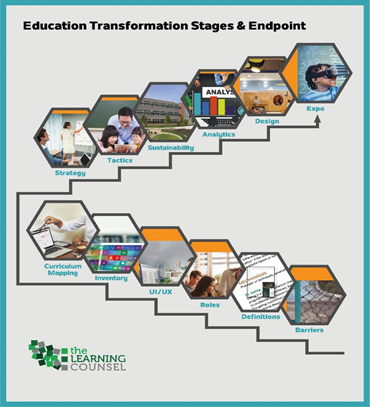
To briefly explain the other points on the Transformation Stages & Endpoint scale:
- Barriers are defined as the budgetary and human resistance to changing to rely on technology. It’s the first stage.
- Definitions as a stage is defined as the point where a great deal of basic understanding of what technology is doing, especially the mechanisms, design and instructional qualities within advanced digital curriculum software.
- Roles as a stage is when schools and districts start to restructure staffing, seeing even the definition of teaching being more precise, separating out and elevating human qualities and letting technology do more of the knowledge distribution and engagement with oversight.
- UI/UX as a stage is when educators start paying a lot more attention to details of what software is really doing and how students can be lost int the digital systems when user interface and user experience are just a jumble of disparate pieces.
- Inventory is a stage when teachers, schools, and especially districts, become concerned with how much software they own and who uses what types of digital curriculum for what purposes.
- Curriculum Mapping as a stage when institutions whittle down redundancies and build out their coverage models of digital learning objects to map against their academic standards.
- Strategy as a stage, while something schools would be typically engaged in making at any point, is now a disciplined action of how to take all the devices and digital curriculum map and make it truly utilized and part of operations.
- Tactics is the stage when leaders have departments take over major portions of the strategic plan and subdivide it even further down to teachers for execution so that the strategy is realized.
- Sustainability as a stage is when leaders become concerned with ongoing budgeting for a widening scope of tech change as well as how new functions can pay for themselves and more.
- Analytics is a stage when teachers and administrators start shifting practice based on numerous analytics coming out of systems.
- Design as a stage is the point when administrators start altering the delivery of teaching and learning so that it leans more wholly on technology and is pointed more at full personalization of student pathways. This is when logistics becomes of central concern.
- The final stage focuses on the experience of the learning and instituting state-of-the-art logistics.
Take-aways
Learning Counsel advises administrators of the following in 2021:
- Let your survival instincts take your thinking into questioning every practice, every organizational principle and how you use time and space to deliver learning.
- Understand what a school must be to remain competitive now, what students and parents want from homeschooling and other options.
- Look, don’t just listen. Seeing demos of what systems really do today is a game-changer. People generally resist change and will fill your ears with words of resistance.
- Have more conversations about what EdTech can really do, including the “network model” of service that dissolves institution-only staffing and allows leaders to think of staff-from-anywhere.
- Understand that traditional whole-group teaching and learning is headed for dissolution in favor of a disaggregated Internet-of-instructs combined with algorithmic workflow to deliver personalized paths for students. This does not mean no more teachers nor does it mean all-online learning. New systems should precisely intersect students with human teaching as needed the same as Uber intersects riders with drivers and sophisticated logistics allows Fed-X to get a package anywhere in the world in 24 hours.
Learning Counsel Research completed the 2020 Digital Transition Survey in October. 32,827 educators participated in the survey online. In 2020 there was a 300 percent increase in responses from small and medium schools and districts. 65 schools, districts and service agencies were awarded one of the Learning Counsel’s prestigious EduJedi Levels of Gainer, Innovator, Achiever or Knight.
U.S. Demographics of the survey responders included:
- 25 percent Urban
- 29 percent Suburban
- 39 percent Rural
- 7 percent Education Service Centers, BOCES, or state entities
Learning Counsel acknowledges and thanks these sponsors for underwriting the presentation of the Survey results briefing during the December 2nd Gathering virtual event:
About the Author

LeiLani Cauthen is the CEO and Publisher of The Learning Counsel. She is well versed in the digital content universe, software development, the adoption process, school coverage models, and helping define this century’s real change to teaching and learning. She is an author and media personality with twenty years of research, news media publishing and market leadership in the high tech, education and government industries.