
The enhanced Vernier Graphical Analysis™ Pro app from Vernier Science Education is designed to meet the needs of today’s science teachers and students. The app, which helps students engage in advanced data analysis as they think critically and make real-world connections, enriches live instruction while providing even more opportunities for students to interact with and analyze data outside of class time.
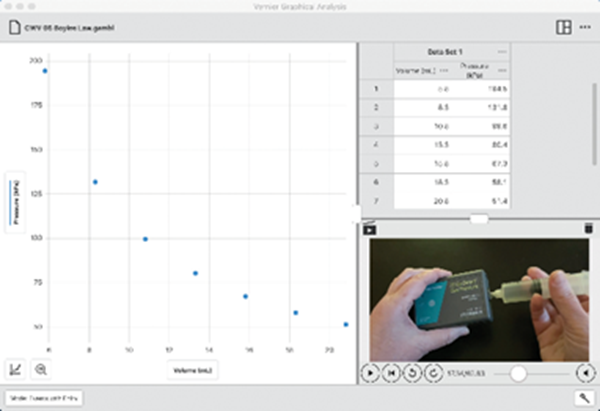
Using Graphical Analysis Pro on a mobile device or Chromebook, teachers and students can easily visualize and interact with experiment data collected using nearly 50 of the sensors from Vernier. They can also view and sync a video to sensor data, which enables students to replay, speed up, slow down, and pause recorded experiments at key moments in time. Wherever learning is happening, the app enables students to perform live experiments and share data over the internet in real time as they analyze and graph data and experience three-dimensional learning.
The Graphical Analysis Pro app includes 45-plus ready-to-analyze experiment videos synced with sample data that cover common topics in biology, chemistry, and physics. These videos include student instructions. Educators can easily assign these experiments for prep work, homework, or a lab make-up assignment.
Formats/platforms used:
Graphical Analysis Pro is compatible with most operating systems and devices used in schools, including Chromebooks. This provides flexibility and cost savings as students can use their own devices for analysis while learning in the classroom, in the field, and at home.
Primary website’s URL:
Problem solved:
Graphical Analysis Pro provides teachers with new ways to enrich their instruction and engage students in advanced data analysis which, in turn, helps students think more critically and make real-world connections.

Grade/age range:
High school and college
Core or supplemental:
Supplemental
Subject(s):
Science, specifically biology, chemistry, and physics.
Lesson time needed:
One of the most significant advantages is the flexibility Graphical Analysis Pro offers. With Graphical Analysis Pro, teachers can easily conduct hands-on investigations within a single class period (typically 45 minutes), allowing for more effective use of time in the classroom. Additionally, teachers can use the software to quickly demonstrate concepts in a short amount of time (usually 10-15 minutes).
The software also enables students to design their own investigations, giving them more control over their learning experience and allowing for greater creativity and engagement. Moreover, the software can be used outside the classroom which provides students the opportunity to continue their learning at their own pace and convenience.
Overall, the use of Graphical Analysis Pro is a powerful tool that can enhance teaching and learning in numerous ways for any classroom.
Pricing model:
A Graphical Analysis Pro site license provides all students and educators at a K-12 school or college department with unlimited access to the award-winning app. A one-year site license with unlimited seats costs $149 and a three-year site license is available for $299.
For individual teachers with smaller classes, per-student licences can also be purchased for $10.
Additional services:
While not specifically needed to utilize Graphical Analysis Pro, students can use nearly 50 of Vernier’s sensors to collect, visualize, interact with, and analyze their own scientific data.
To ensure the successful use of the technology, all Graphical Analysis Pro users – just like all Vernier customers – have ongoing access to Vernier’s best-in-class support. In addition to a collection of robust support materials, this includes access to the Vernier Tech Support team which is primarily made up of former science teachers. This team is uniquely qualified to help teachers with everything from helping to choose the appropriate technology for a given lesson to quickly troubleshooting a technical issue in the middle of class.
What makes Graphical Analysis Pro unique?
With Graphical Analysis Pro being regularly updated based on teacher feedback and at no additional charge to users, teachers and students can continually take advantage of new features that support teaching and learning.
This notably includes a new Annotation feature which enables students to leave comments on a region or a point of a graph in the app. Now, students can demonstrate their understanding of graphs and show they know how the story of the graph corresponds to what happened in the real world.
Other recent updates include:
● The ability to strikethrough unwanted data
● New functions in custom calculated columns
● Option to display uncertainty of curve fit parameters
● Adjustable number of points used in derivative calculations
● Additional graph types, including bar graphs, histograms, and “Fast Fourier Transforms”
● Ability for custom curve fit expressions to be entered by the user
● The ability to add error bars to graphs so that students can convey the reliability of measurements
● The ability to plot categorical data
● The ability to record important events with one click, such as noting the moment a sample starts to melt using the Go Direct® Melt Station
Characteristics:
Graphical Analysis Pro is designed to meet the needs of users – teachers and students.
The user interface and user experience allow students to collect data quickly using the app’s defaults. Most Vernier Go Direct devices, the wireless handheld data-collection tools, have multiple sensors included so the defaults are set up for the most-used experiments. This enables students to connect and get collecting data as quickly as possible with limited barriers.
Graphical Analysis Pro is also designed to have intuitive graphics with limited distractors including only the icons that are necessary to operate the software.
Here’s what users are saying:
“My task is to challenge [my students] with a real-world problem and allow them time to think critically, work in collaborative groups, and find solutions. The sensors, along with Graphical Analysis, have been great tools for my students.”
– Amy Hindbaugh-Marr, a STEAM teacher at Ithaca Public Schools in Ithaca, MI
“Graphical Analysis Pro is very ‘plug and play’ and really intuitive to set up. When we first implemented it, we were up and running with data in 10 minutes and kind of shocked by how very easy it was. This technology is like driving a Tesla compared to an old Ford.”
– Dr. Thomas Hancock of Portland State University in Portland, OR