
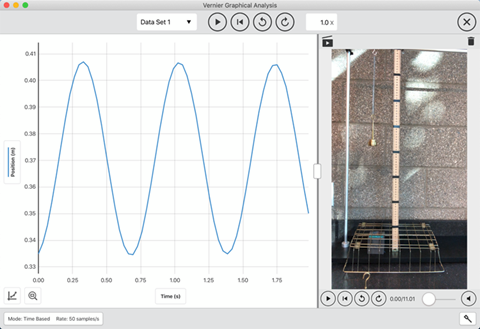
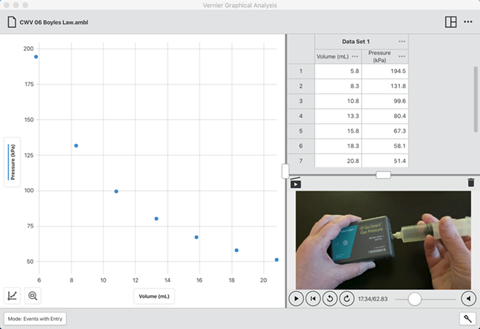
The Vernier Graphical Analysis™ Pro app from Vernier Software & Technology engages students—either remotely or in the lab—in advanced analysis of data from biology, chemistry, and physics experiments. With the new Graphical Analysis Pro app, users can insert, view, and sync a video to sensor data for inspection and analysis.
Graphical Analysis Pro inspires students to explore crucial science concepts with its illustrative experiment videos and interactive graphing capabilities. Students can analyze data in new complex and insightful ways. With this app, educators can perform live experiments for students learning remotely and share the data with them in real time for immediate analysis.
Formats/platforms used:
Windows, macOS, Chromebook, iOS Devices, and Android Devices
Primary website’s URL:
https://www.vernier.com/graphical-analysis-pro/
Problem solved:
Graphical Analysis Pro helps students explore and gain a deeper understanding of important science concepts regardless if the learning is happening in the lab or remotely. It allows students to analyze experiments at their own pace and create their own videos for scientific analysis. Teachers can additionally perform live experiments using the app or utilize the sample experiments as part of their instruction.
Grades/age range: can use your product?
High school and college levels
Core or supplemental?
Core
Topics:
STEM, specifically biology, chemistry, and physics.
Lesson time needed:
This depends on which experiment or lab the teachers wants to conduct – teachers can use the app for quick data analysis or over the course of several days depending on how it is being used.
Pricing model:
The app, which is available as part of a 30-day free trial, is being offered at a special introductory site license price of $69. This introductory site license grants access to the app for all users at the site through June 2021.
Additional services needed:
This is a stand-alone app, however, it can be used with most Vernier sensors so that teachers can continue to use them as part of their instruction, even if students are learning remotely.
What makes Vernier Graphical Analysis™ Pro unique?
Teachers can conduct live experiments in real time with students and use the internet data sharing feature to send them the experiment data for immediate analysis. Dozens of sample experiments with videos synced with data and complete instructions are included in the app. Also, the multiple platform compatibility provides a means for data analysis anywhere a student has a device – not just the lab.
Characteristics:
The user interface is designed to be simple to understand and intuitive. Visual clues like icons and contextual messages guide the user as they access different tools within the software. The app is responsive and is designed to work well on any platform or device, and grants a consistent experience from platform to platform.