The Incorporated Research Institutions for Seismology (IRIS) has created an online version of its popular activity “Determining and Measuring Earth's Layered Interior” to challenge students to use evidence from earthquake data to understand the Earth’s interior layers. This free web-based tool for Earth Science classrooms was funded in part by the National Science Foundation.
The activities contained within the tool emphasize the use of models and the importance of using empirical evidence to make discoveries in Earth Science. When using the tool, students act as scientists as they discover and analyze real-world data. This exploration encourages independent thinking, data analysis, and engineering and design as it builds an understanding of this dynamic planet and its internal engine.
“Students today have unprecedented access to seismic data and web tools that allow them to explore fundamentally big ideas such as the predictive power of models to help explain the Earth’s system and to measure the Earth’s core,” said Michael Hubenthal, Senior Science Education Specialist at IRIS.
Formats/platforms used:
The app operates in a browser.
Primary website URL:
Iris.edu
Problem solved:
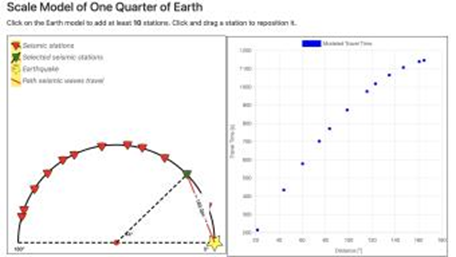
The “Determining and Measuring Earth's Layered Interior” tool allows students to explore and analyze the data that scientists use to understand the layers of the Earth.”
Using the tool, students answer interactive questions such as “How do the Earth's systems interact?” and “Why do scientists use models?” The tool offers detailed instructions, embedded instructional videos, and a downloadable certificate upon completion.
Grade/age ranges:
Grades 6-12
Subject/topics:
Science
STEM
Earth Science
Lesson time needed:
30 minutes
Pricing model:
Always free
What makes IRIS unique?
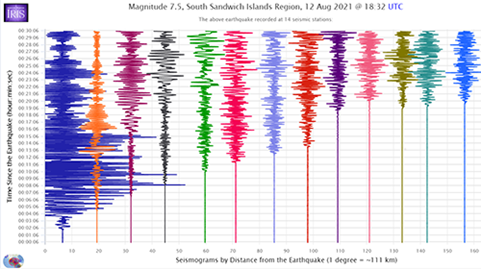
The activity uses actual data recorded by seismic stations from around the world. Using this data, students are able to discover what makes up the Earth’s core, just as scientists do.
Characteristics:
This activity was built using the science and engineering practices outlined in The Framework for Science Education and Next Generation Science Standards.
Specifically:
Asking questions and defining problems
A practice of science is to ask and refine questions that lead to descriptions and explanations of how the natural and designed world works and which can be empirically tested.
Developing and using models
A practice of both science and engineering is to use and construct models as helpful tools for representing ideas and explanations. These tools include diagrams, drawings, physical replicas, mathematical representations, analogies, and computer simulations.
Planning and carrying out investigations
Scientists and engineers plan and carry out investigations in the field or laboratory, working collaboratively as well as individually. Their investigations are systematic and require clarifying what counts as data and identifying variables or parameters.
Analyzing and interpreting data
Scientific investigations produce data that must be analyzed in order to derive meaning. Because data patterns and trends are not always obvious, scientists use a range of tools—including tabulation, graphical interpretation, visualization, and statistical analysis—to identify the significant features and patterns in the data. Scientists identify sources of error in the investigations and calculate the degree of certainty in the results. Modern technology makes the collection of large data sets much easier, providing secondary sources for analysis.
Using mathematics and computational thinking
In both science and engineering, mathematics and computation are fundamental tools for representing physical variables and their relationships. They are used for a range of tasks such as constructing simulations; statistically analyzing data; and recognizing, expressing, and applying quantitative relationships.
Here’s what users are saying:
The quotes below are from teachers at the National Science Teachers Association meeting where the app was introduced for the first time. Teachers participated in a workshop to learn the new tool.
“Good activity to use - especially the independent aspect for students.”
“Very well-designed; Good Pedagogy; easy to use; substantial content.”
“It’s super interactive and easy for students to see the connection through data. You do not lose class time to students not being able to calculate as it does this for you.”