Editor’s Note: This three-part series seeks to identify the problem to act on, rather than approach each challenge as isolated.
As stated in the first article, if the problem that is attempting to be solved is not the problem, it won’t be solved. It will get worse.
On the attrition problem, let’s start with the fact that there are 13.5 million K-12 school-aged children that are possibly not going to any type of schooling environment including homeschooling. These could be dubbed the possible “off-grid” students, which could be recently arrived immigrants, transient families, or those that fall into something between school and homeschool, in emerging flexible scenarios. There are, in fact, issues with data in America. There’s big change, and most measurements are mere datapoints or missing categories.
“We now have substantial data suggesting that the public school system will likely lose millions of students this school year. An August nationwide survey from Gallup suggests that the proportion of students enrolled in traditional public schools might drop by seven percentage points, with a random sample of 214 parents telling pollsters what type of education option they will choose for their oldest child this year—whether that be a public, charter, private, parochial, or homeschool option. Because around 50 million children were enrolled in public schools pre-pandemic, this finding implies that about 3.5 million students may leave the system.” -- Cayla Bamberger, June 15, 2022, NY Post
Post-pandemic, schools and districts are still experiencing more attrition. A large loss of students against projections is shocking to leaders as they deal with enormous commensurate loss in revenue. Making up for this right now is the fact that money is readily available for most from the Stimulus coffers.
The Datapoint Issue
Here’s just a few data points, but the list goes on and on and no state has been immune. Extremely few districts either. The list was chosen to show what’s happening both at the state and district levels, large and small districts. The problem with this data is that it is all individual points across America. There’s always that one or two districts or schools who are growing. As data then, it’s easy to think it’s not universal, but a short trend due to the pandemic or reduced birth rates. It’s easy to leave the scale of it vague and disregard it to act locally without much respect to the fact that there is something deeper to consider. Or to rationalize the attrition issues because your one district is doing okay.
- New York State. According to the NY Post, “The number of students in schools operated by the city Department of Education was just over 919,000 for 2021-22 — a loss of almost (37,000) students since the school year began, according to figures released Wednesday. The data reflected a longer trend of students and families leaving the school system — including a more than 8% decrease in enrollment since the start of the pandemic. There were 1,002,200 kids in the public schools in 2019-20, compared to 955,490 in 2020-21. School officials attributed the decline broadly to the pandemic, as well as population shifts and stalling birth rates.”
- New York City. 75 percent of NYC public schools enrolled fewer students this year. About three quarters of the city’s public schools saw enrollment declines this year, with nearly 23 percent losing 10 percent or more of their students, state figures show.
- Philadelphia. Chalkbeat Philadelphia reports, “In drafting its 2023 fiscal budget, officials are projecting a loss of 7,000 students next year, down 6% from this year’s total of 115,000 in district-run schools. This decrease would result in a loss of 350 teachers who are allotted based on enrollment. Another 83,000 Philadelphia students attend charter schools, including 14,000 in cyber charters.”
- Arlington Public Schools, VA. About 2,000 students who left Arlington Public Schools after buildings shuttered in March 2020 have indicated they will not be returning this fall, according to APS staff.
- Del Mar Union School District, San Diego area, CA. Enrollment has dipped in the Del Mar Union School District with 3,701 K-6 students starting the school year, down from 3,944 at the end of 2021-22.
- State of California. CalMatters says, “For the first time since the start of the century, California has fewer than 6 million students attending public schools.
- Statewide enrollment has dropped by more than 110,000 students to 5,892,240 during the current school year, a 1.8% dip from last year but less steep than the 2.6% decline during the first year of the pandemic.
- Charter school enrollment also is down for the first time since at least 2014.
- Kindergarten enrollment is up, though nowhere near pre-pandemic levels.
- And 9,000 more students are enrolled in private schools, a 1.7% increase, but that doesn’t explain much of the exodus from public schools.”
- Sarasota County, FL. In 2020-21 school year projected an enrollment of 44,845 but enrolled 43,388 students. Because the district is awarded about $8,000 annually for each enrolled student, without the executive order, the district would have lost $11.6 million.
- Chicago Public Schools. According to the Herzog Foundation, “Analysis shows CPS has lost about 63,500 students during the past decade. That leaves about one-third of CPS’ traditional, non-charter schools less than half full. Five schools are less than 10% full, according to the analysis. At the same time, district proficiency is at record lows. For example, in 2020-2021, only 21% of third- through eighth-grade students scored as proficient in reading, and only 16% scored as proficient in math. Despite the issues plaguing the district, the schools still receive larger amounts of funding each year.”
The datapoint issue, then, is that a lot of loss is happening, at a scale America has never experienced before – but mere datapoints are not the problem. They only indicate there is a problem that needs further investigation.
The Hidden Data Issue
For reasons unknown, there is conflicting research as to what is really going on, which tends to hide the sheer scale of change.
|
Source |
Total Population of K-12 Aged Persons |
K-12 Enrollment |
Year |
Observations |
|
Learning Counsel Research |
|
56.0 M K-12 Total Leaners 35 M - 62.50% Public Traditional 9.3 M - 16.60% Homeschoolers 5.4 M - 9.70% Private 4 M 7.2% - Public Charters 2.2 M - 4% Public Online Only
Possible 7.3 - 13.5 M in growth of population unassigned or growth in flexi/hybrid/hybrid logistics. |
2021 |
Learning Counsel makes projections of homeschoolers even for States where they are not required to be reported, the “off-grid” student. Note that some homeschoolers may be getting curriculum maps from traditional public or taking some or all their courses online and so are in a gray area of public but not traditional or on campus. Note LC did not adjust it’s top-line number for several years of total learners and will be issuing new data in late 2022. |
|
NCES |
|
61.4 M K-12 Enrolled |
2020 |
A year behind, citing 55.4 M public, 6 M private. This is a difference above Learning Counsels enrolled data of +5.4 M students, and discludes homeschoolers and pre-primary. “In 2020–21, among adults 18 years old and over who had students under 18 in the home, 6.8 percent reported having at least one child homeschooled. When examined at the child level, the data show that 5.4 percent of children were reported to be homeschooled in 2020–21.” This would be an additional number of students over the 61.4 M |
|
Statistica |
63.3 M K-12 Aged |
|
2021 |
This is 7.3 M more K-12 aged than cited by Learning Counsel – which may partly be because Statistica double-counted 5-year-olds. Additionally, there may be far more “off-grid” students than projected by Learning Counsel or NCES which would technically fall into the “homeschooling” or a new category of no-schooling despite compulsory laws. |
|
U.S. Census Bureau |
69.5 M K-12 Aged |
|
2021 |
This is 13.5 M more K-12 aged than cited by Learning Counsel and may be being projected based on more knowledge of immigration than any other source. Expect other organizations to adjust their percentages using an extension of this baseline into 2022-23. |
|
U.S. DOE |
|
61.2 M K-12 Total Enrolled 49.4 M K-12 Public Traditional 3.4 M K-12 Public Charter 4.7 M K-12 Private Schools 3.75 M K-12 Homeschoolers*
Possible 2.1 - 8.3 M in growth of population unassigned in 2021, or unaccounted flexi/hybrid/hybrid logistics. |
2019-20 |
This data is a year behind other data. “From fall 2019 to fall 2020, total public-school enrollment in prekindergarten through grade 12 dropped from 50.8 million to 49.4 million students. Between fall 2009 and fall 2019, overall public charter school enrollment increased from 1.6 million students to 3.4 million students and the number of public charter schools increased from approximately 5,000 to 7,500. During this period, the percentage of public-school students who attended charter schools increased from 3 to 7 percent. In the fall of 2019, some 4.7 million kindergarten through grade 12 students (9 percent) were enrolled in private schools.” * Percentage taken as a baseline of the USCB total population from NCES data cited by USDOE.
|
See Sources for citations.
The anomalies in all these data sources when compared one to the other that must be considered when it comes to loss of students and attrition is that:
- The possible additional or missing total numbers of persons aged for K-12 has some huge disparities, a 13.5 million difference, possibly due to more knowledge about immigration or a missing knowledge about losses from the pandemic. Other problems could be double-counting age groups and other rather common errors in big research. Still, at between 7.3 million and 13.5 million school-aged students not cited in the preeminent numbers by NCES, something very significant is going on that may be shielding the truth.
- If NCES’s data of “5.4 percent of children were reported to be homeschooled in 2020–21,” and the baseline was the U.S. Census Bureau data, it would have been 3.75 million homeschoolers. It’s hard to make sense, though, of the “6.8 percent of adults report at least one child homeschooled,” but “only 5.4 percent at the child-level were reported to be homeschooled.” What’s that all about –more adults cite one or more children being homeschooled, but some examination showed it was 3 percent lower actuals than the adults said? That’s potentially millions of students. The data citations are confusing.
- Several citations are well above earlier numbers on homeschooling. There is a definite change, but it is not necessarily well-defined because what is “public” could in fact be more like a private-public partnership that parents consider to be homeschooling, or a fully-online charter not affiliated with local districts but run by a state, or some private enterprise that is helping homeschoolers with curriculum and even live or chat-bot teaching but not as a “school.” There are thousands of such offerings online.
For readers, what’s important to know is that the attrition of students is being felt in real-time by many schools and districts nationwide, but the alarms haven’t really gone off nationwide. The anomalies in the data here seem to indicate that perhaps there has been something off with the top-line of the total numbers of persons in the age group of K-12 versus what has been called the total accounted for in any alternative. By a huge amount.
What these two things mean together is that there are a potentiality of losses to homeschooling, to alternatives of any kind, far larger than governments are finding out. Possibly the biggest new alternative is a no-school-at-all alternative which no government enrollment data anywhere is showing. Many states do not require reporting by parents.
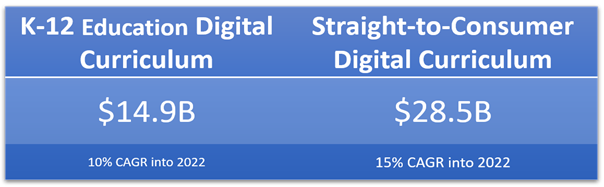
The at-home finding of Apps and courseware with chatbot teaching, “off-griding” learning, or purchasing from commercial providers of any kind, is a sort of netherworld that is literally unknown to educators. Learning Counsel cites the consumer spend in these types of curriculum materials is easily twice the level of spend on the same digital types of things that on which all schools and districts combined spend.
In fact, spend by consuming parents, grandparents, and students themselves increased by 5.7 percent in 2021, jumping up spend by almost $6B. In truth, school spending rate on professional grade digital curriculum and courseware is now experiencing a faster rate of growth in 2022 than prior years and is expected to maintain this rate for several years as going digital takes the place of merely digitized elements without quality workflow. Major gainers on the consumer side include full subscription curriculum for homeschoolers most schools are unfamiliar with, and explosive growth in direct-to-consumer sales for companies who normally have sold mostly to schools. (Global mobile app market alone was $582B in 2020.)
The problem with the numbers is not the problem with attrition in schools, but it points to a problem with understanding new categories of change and measuring them.
The Vague Longing Issue
Something did happen with the pandemic, but it was a mere sharp inflection upwards to an already rising trend. The longing for change in American educational systems has been building.
Statements like, “Something is going on, but I can’t quite put my finger on it,” have been common by school leaders in conversations with Learning Counsel and sum it up. Leaders realize something has happened, but both the scale of it and why, is elusive.
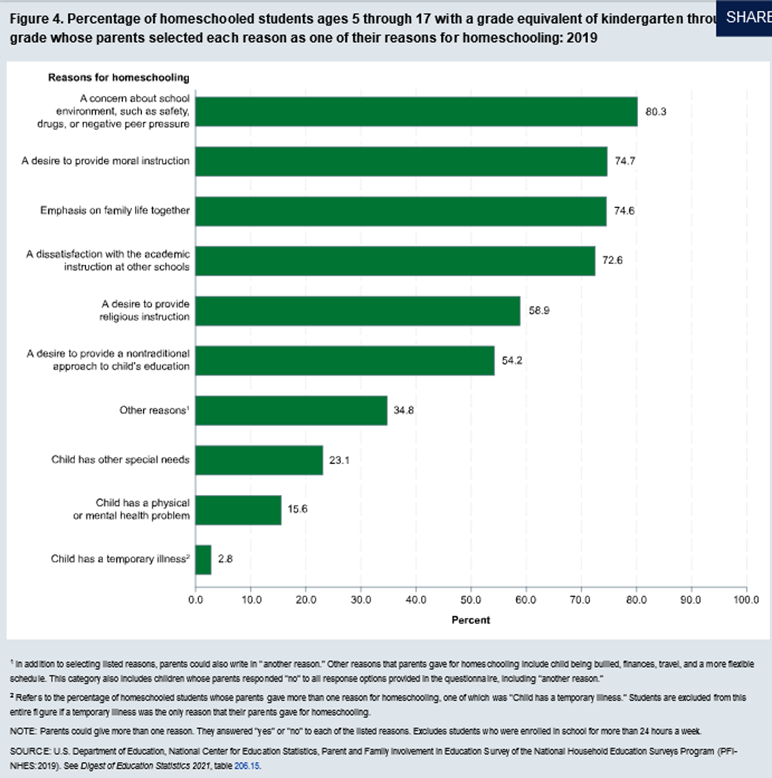
The U.S. Department of Education has at least formulated some reasons and asked for responses from homeschoolers, a percentage of all the opt-outers from the traditional grade-and-class structured schooling. The most interesting of these responses is that 34.8 percent said either “no” to all offered reasons or “other reasons.” Inside that are possibilities it was for “a more flexible schedule.”
A more flexible schedule is, in fact, implied in many of the possible responses as a part of the need. It is overlooked for its meaningfulness.
Meanwhile, large doses of media editorial have been appearing around things like “flexi schooling,” “hybrid learning,” and “hybrid logistics.” These are all about altering time, and the way it is used for learning.
Time is a luxury. It is the most immutable of the big four foundations of existence – space, energy and matter being the other three. Time cannot be turned back. Once it slips past it is gone forever.
The vague longing for flexibility has a lot to do with time, and perhaps equally with space and the ability to be remote at will. Flexibility in turn, implies personalization. All the reasons are symptoms of large systems not really knowing the learner. Not knowing the individual well, in the age of technology, is further a symptom of misapplication of technology or just not enough of it. This is disrelated to teachers and more related to systems that use data to feed teachers correctly.
The two things, time and space, have become commodities in modern society. The best use of them technologically gains commercial value. Uber, Amazon, Fed-X, the entire travel and entertainment industries including virtual reality, and others have created manipulations of our use of time and space, freeing us to our own time and pursuit of varied or comfortable home spaces. They have used logistical and high-value digital navigation and facets of images or animations, sound and user interface, to find efficiencies and better experience for users. In outside industries these are all happening. Yet in traditional schools, the minutia of curriculum, who is teaching what and exactly how, and furniture choices, have changed and have ongoing revisions, but the form and structure is largely the same for time and space. Siloed subject-specific programs shift, but the overall form remains the same. The logistics and interface are teacher-centric rather than systems-oriented. Leaders lead through the teacher hubs, and are handicapped by ineffective teachers.
Then the pandemic happened and every possible profession that wasn’t “front line workers,” worked from home. This was a tectonic plate shift and the reverberations on schools will never end.
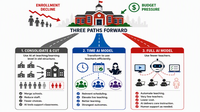
The problem with the problem of attrition is not just that students are leaving for alternatives. The problem with attrition is that it is flowing to something that is largely uncodified. It is a something else, potentially many somethings, that are not yet defined in full. Those things are a rebellion specifically of the old master schedule, the buildings divided into smaller squares and students moving along a conveyer belt towards a destination normalized for all. Normal is so not normal anymore that it should perhaps no longer even be a word. Expectations by a generation that has had high tech underlying every aspect of life, of something better, are beyond add-on props and are holistic in nature. The structure itself of time and space, but since it is also a fracturing into the multiplicity of human need, the answer will not be singular.
“Back to normal,” is the most wrong that wrong could be for schools and a direct cause of attrition. The new normal is most probably something in the middle between the age-old traditional structure and the fully-online, almost teacher-less option -- only much better than the early days of distance learning where students were easily lost because resources were digitized and not complete with great user interface, messages, notifications, and far better navigational cues. It is probably something that artfully combines the two worlds, weaving in the human interface with precision. It is also not confined to a single institution but will use human and digital resources from anywhere, on-demand, a personalized matrix of learning experience.
The problem with the problems in education then, is not attrition, which is merely a symptom of a larger scene.
About the author

LeiLani Cauthen is the CEO and Publisher of The Learning Counsel. She is well versed in the digital content universe, software development, the adoption process, school coverage models, and helping define this century’s real change to teaching and learning. She is an author and media personality with twenty years of research, news media publishing and market leadership in the high tech, education and government industries.
Sources
1) Enrollment at NYC public schools continues startling plummet, data shows, Cayla Bamberger
June 15, 2022 8:35pm, https://nypost.com/2022/06/15/nyc-public-schools-enrollment-continues-to-decline/ “The number of students in schools operated by the city Department of Education was just over 919,000 for 2021-22 — a loss of almost (37,000) students since the school year began, according to figures released Wednesday. The data reflected a longer trend of students and families leaving the school system — including a more than 8% decrease in enrollment since the start of the pandemic. There were 1,002,200 kids in the public schools in 2019-20, compared to 955,490 in 2020-21. School officials attributed the decline broadly to the pandemic, as well as population shifts and stalling birth rates.”
2) 75% of NYC public schools enrolled fewer students this year. Here’s a breakdown of every school, Chalkbeat NY, By Alex Zimmerman and Thomas Wilburn, Jan 28, 2022, 4:25pm CDT, https://ny.chalkbeat.org/2022/1/28/22907058/nyc-school-level-enrollment-decline-search
“About three quarters of the city’s public schools saw enrollment declines this year, with nearly 23% losing 10% or more of their students, state figures show. Black and white students in grades K-12 saw the largest drops of all racial groups this school year, declining about 7.5% each. Asian American student enrollment dropped 5%. For Latino students, the drop was 4.5%... The state figures show that overall enrollment in the city’s traditional public schools dropped 5.6% this year among students in grades K-12 to roughly 821,000 students, according to a Chalkbeat analysis. Since the pandemic hit in the 2019-2020 school year, K-12 enrollment has dropped by 9%. City officials noted the state data does not include a slew of nontraditional programs, so the figures are lower compared with the city’s own enrollment tallies.”
“School systems across the country have also experienced enrollment declines this year, including nearly 6% in Los Angeles and 3% in Chicago, the nation’s second and third largest districts.At the Earth School in Manhattan, enrollment declined by about 18% to 241 students, state data show. Jia Lee, a fourth and fifth grade teacher, said the drop has meant her classroom has 28 students instead of a more typical 21-24, in part because the school can’t justify hiring a teacher to staff an additional classroom.”
“At Brooklyn’s P.S. 295 which lost about 22% of its students over the past year, and about 15% the previous year, there was a confluence of events that may have led to the decline, families said.
A change in leadership last year may have given some parents pause, and the year before that a beloved parent coordinator left. That parent coordinator was a big help to the school’s Spanish-speaking families who needed free after-care — which the school does not offer on site. He would bring some students to a free program at a nearby school, said P.S. 295’s PTA president Tina Habib. Without that, some families may not have been able to send their children to the school.
Another reason: The school has been embroiled in a high-profile fight since this summer when officials removed a Black Lives Matter and Black Trans Lives Matter mural with a quote from feminist author Audre Lorde: “Your Silence Will Not Protect You.”
“People have expressed concern about the reduced numbers,” Habib said, “But the response from the administration has been: ‘It’s COVID. This is normal. All schools are losing students. Don’t worry about the funding because of the stimulus money.’”
3) Philadelphia City Council questions district on projection for lower enrollment, May 4, 2022, Chalkbeat Philadelphia, https://philadelphia.chalkbeat.org/2022/5/4/23057820/philly-city-council-question-projection-declining-enrollment-school-closures In drafting its 2023 fiscal budget, officials are projecting a loss of 7,000 students next year, down 6% from this year’s total of 115,000 in district-run schools. This decrease would result in a loss of 350 teachers who are allotted based on enrollment. Another 83,000 Philadelphia students attend charter schools, including 14,000 in cyber charters.”
4) Lower Enrollment Could Help Bail APS Out of $11M+ Deficit, ARLNow, Jo DeVoe, May 5, 2021 at 2:10pm, https://www.arlnow.com/2021/05/05/lower-enrollment-could-help-bail-aps-out-of-11m-deficit/
5) Del Mar Union School District keeps watch on declining enrollment, Del Mar Times, Karen Billing, Aug. 31, 2022 https://www.delmartimes.net/news/education/story/2022-08-31/del-mar-union-school-district-keeps-watch-on-declining-enrollment
6) California public school enrollment drops below 6 million mark, CalMatters, Joe Hong, April 11, 2022, https://calmatters.org/education/k-12-education/2022/04/california-public-school-enrollment/ “For the first time since the start of the century, California has fewer than 6 million students attending public schools.”
- Statewide enrollment has dropped by more than 110,000 students to 5,892,240 during the current school year, a 1.8% dip from last year but less steep than the 2.6% decline during the first year of the pandemic.
- Charter school enrollment also is down for the first time since at least 2014.
- Kindergarten enrollment is up, though nowhere near pre-pandemic levels.
- And 9,000 more students are enrolled in private schools, a 1.7% increase, but that doesn’t explain much of the exodus from public schools.”
7) School district weighs effects of lower enrollment for 2021-22, Brynn Mechem, YourObserver.com, https://www.yourobserver.com/article/school-district-weighs-effects-of-lower-enrollment-for-2021-22 “The Sarasota district in 2020-21 school year projected an enrollment of 44,845 but enrolled 43,388 students. The district receives about $8,000 annually for each enrolled student, which means without the executive order, the district would have lost $11.6 million.”
8) Chicago Public Schools facing lower enrollment, Aug. 23, 2022, The Lion, a Publication of the Herzog Foundation, https://readlion.com/2022/08/23/chicago-public-schools-facing-lower-enrollment-but-more-teachers/ “Analysis shows CPS has lost about 63,500 students during the past decade. That leaves about one-third of CPS’ traditional, non-charter schools less than half full. Five schools are less than 10% full, according to the analysis.
At the same time, district proficiency is at record lows. For example, in 2020-2021, only 21% of third- through eighth-grade students scored as proficient in reading, and only 16% scored as proficient in math.
Despite the issues plaguing the district, the schools still receive larger amounts of funding each year, according to IPI’s Mailee Smith.
“People are seeing their property taxes increase, and the schools are getting more funding because of it,” Smith said. “Unfortunately, within CPS, that is not correlating with a better academic outcome for the students.”
9) COVID-19 Didn't Break the Public School System. It Was Already Broken. Corey A. DeAngelis, December 2020 issue, https://reason.com/2020/11/03/covid-19-didnt-break-the-public-school-system-it-was-already-broken/ “We now have substantial data suggesting that the public school system will likely lose millions of students this school year. An August nationwide survey from Gallup suggests that the proportion of students enrolled in traditional public schools might drop by seven percentage points, with a random sample of 214 parents telling pollsters what type of education option they will choose for their oldest child this year—whether that be a public, charter, private, parochial, or homeschool option. Because around 50 million children were enrolled in public schools pre-pandemic, this finding implies that about 3.5 million students may leave the system. The education establishment is panicked, but there is little it can do to stem the flow once families determine to take matters into their own hands. What remains is the task of restructuring the underlying funding mechanisms to attach money to students instead of institutions, so that more families are empowered to escape a system that isn't working for them. Arizona's largest school district reported a 5.6 percent decrease in enrollment from last year. Clark County, Nevada, reported a 3.4 percent drop. In Florida's Orange County, enrollment is down about 9 percent from projections. In Nashville, it's down 4.5 percent from projections. And as of August 28, over 3,000 students—about 1.6 percent of total enrollment—had filed to withdraw from Virginia's Fairfax County Public Schools and switch to homeschooling or a private school.”
10) Resident population of the United States by sex and age as of July 1, 2021 (in millions), Statistica, https://www.statista.com/statistics/241488/population-of-the-us-by-sex-and-age/
Total population per Census and immigration data equal to 63,310,000 aged 5-19.
11) https://www.census.gov/quickfacts/fact/table/US/PST045221 U.S. Census Bureau 6-18 years old is 69,480,627 in 2021. “Overall enrollment in kindergarten through 12th grade in 2018 was 53.1 million, compared with 53.7 million enrolled in 2011. Enrollment in K-12 private schools was 4.4 million in 2018, not statistically different from the level in 2009, after having fallen by 20% from 2000 to 2009.”
12) Public School Enrollment, National Center for Education Statistics (NCES), May 2022 https://nces.ed.gov/fastfacts/display.asp?id=65; https://nces.ed.gov/programs/coe/indicator/cga/public-school-enrollment
“From fall 2019 to fall 2020, total public-school enrollment in prekindergarten through grade 12 dropped from 50.8 million to 49.4 million students. Prior to this period, total public-school enrollment had increased between fall 2009 and fall 2019. Changes in public elementary and secondary school enrollment varied by state.”
“Between fall 2009 and fall 2019, overall public charter school enrollment increased from 1.6 million students to 3.4 million students and the number of public charter schools increased from approximately 5,000 to 7,500. During this period, the percentage of public-school students who attended charter schools increased from 3 to 7 percent.”
“In the fall of 2019, some 4.7 million kindergarten through grade 12 students (9 percent) were enrolled in private schools.”
“In 2020–21, among adults 18 years old and over who had students under 18 in the home, 6.8 percent reported having at least one child homeschooled. When examined at the child level, the data show that 5.4 percent of children were reported to be homeschooled in 2020–21.”
13) https://nces.ed.gov/fastfacts/display.asp?id=16 In 2020, there were 2.0 million status dropouts between the ages of 16 and 24, and the overall status dropout rate was 5.3 percent.
14) Global Mobile App markets https://techjury.net/blog/app-usage-statistics/
15) Wrenshall School enrollment trends lower than expected, The Pine Journal, Dylan Sherman, August 04, 2022 03:09 PM, https://www.pinejournal.com/news/local/wrenshall-school-enrollment-trends-lower-than-expected
16) Some L.A. schools face uncertain futures as student enrollment declines dramatically, Melissa Gomez Staff Writer, March 8, 2022 Updated 2:40 PM PT, Los Angeles Times, https://www.latimes.com/california/story/2022-03-08/los-angeles-lausd-schools-student-enrollment-declines
17) Editorial: Declining enrollment shouldn't always mean shutting down schools, The Times Editorial Board, April 15, 2022, Los Angeles Times,https://news.yahoo.com/editorial-declining-enrollment-shouldnt-always-120056173.html “Where have all the children gone? California's public school enrollment is down by 110,000 students this year, continuing a five-year decline, and no one is sure why or what to do about it. Possible contributing factors include families moving out of state, students switching to private schools or homeschooling; a decrease in immigration to the U.S. and a lower birth rate. Saddest of all, there might be kids who gave up on their education after the COVID-19 pandemic school closures. But the drop in enrollment has fallen on schools with disproportionately high numbers of Black students. Enrollment at some of these schools has fallen so low that they can’t offer as many courses and, in some cases, classes lack enough students to cover the teacher’s salary. When the numbers fall low enough, it can be hard to justify the expense of having a principal, school secretary, nurse and librarian.
This is playing out right now in Inglewood, where the number of students has fallen from about 17,000 a couple of decades ago to fewer than 8,000 and the district is planning to close down an elementary school built for 400 students that has fewer than 150 this year. Parents are protesting the plan, saying that shutting down the school in a mostly middle-class Black neighborhood will do serious harm to the surrounding community.
18) Lower enrollment may cause changes within Seattle Public Schools, Channel K5, https://www.king5.com/article/news/education/lower-enrollment-seattle-public-schools/281-88a0083b-d2a1-43b3-b050-c936a58e0e89 “On the district's website, it states the district budgeted for 52,165 students this school year, but actual enrollment was 1,915 fewer students. The difference resulted in a $28 million gap in revenue. The district anticipates the lower enrollment will continue, and that means staffing adjustments.”
19) Sonoma Valley Unified School District’s student enrollment falls by 2%, Daniel Johnson, Index-Tribune Staff Writer, Sept. 5, 2022, 2:50PM, https://www.sonomanews.com/article/news/school-districts-student-enrollment-falls-by-2/ “The enrollment total declined from 3,334 in 2021-22 to 3,265 in 2022-23, but in its “Student Population Forecast by Residence: School Year 2021-22 Report,” Davis Demographics predicted it would fall to 3,166, a 5% drop.”
20) Newark schools face threat of lower enrollment as applications plunge, Chalkbeat Newark, Patrick Wall, Jul 9, 2021, 10:20am CDT https://newark.chalkbeat.org/2021/7/9/22568624/newark-schools-face-lower-enrollment-applications-plunge “The number of applicants to Newark schools plummeted by nearly 34% this year, according to district data, raising the possibility of a steep enrollment decline this fall.
About 4,000 fewer students applied for seats in the most recent admissions cycle than in the previous year, according to the district’s count, which includes applications to traditional schools and most charter schools. In total, roughly 7,800 students submitted applications through a system called Newark Enrolls this winter, down from nearly 11,800 applicants the previous year.”
21) Austin public school enrollment in the doldrums, AustinAxios, Asher Price, Nov. 9, 2021, https://www.axios.com/local/austin/2021/11/09/austin-public-school-enrollment-down
“Hammered by the coronavirus, enrollment in Austin public schools now clocks in at 74,727 — a few thousand short of the district's goal. Enrollment in Austin public schools has declined year over year recently, down from more than 85,000 in 2018 — even as the city's population booms. The shortfall of 2,605 students translates to a loss of $15 million.”
22) The Rise of Flexi Schooling, The Guardian, Jeevan Vasagar,Mon 5 Dec 2011 15.59 EST https://www.theguardian.com/education/2011/dec/05/rise-of-flexi-schooling
23) What is Flexi Schooling? The School Run, https://www.theschoolrun.com/what-flexi-schooling
24) Parents eye another option for fall: Hybrid home schooling, The Christian Science Monitor, By Chelsea Sheasley Staff writer, May 19, 2021 https://www.csmonitor.com/USA/Education/2021/0519/Parents-eye-another-option-for-fall-Hybrid-home-schooling
25) Hybrid Logistics is Solving Education’s Most Urgent Challenges: Here’s How You Can Help, Learning Counsel, Chris McMurray, https://thelearningcounsel.com/article/hybrid-logistics-solving-education%E2%80%99s-most-urgent-challenges-here%E2%80%99s-how-you-can-help